A research result is the end of a sequence of records: who entered an experiment, which condition was assigned, what exposure occurred, how outcomes were measured and which observations reached the analysis. Each link matters. A polished graph can be numerically accurate while still requiring careful explanation of that sequence before its meaning becomes clear.
Here the central question is how to preserve a comparison as observations accumulate and some become unavailable. We examine the logic of pairing, the difference between a measurement and its interpretation, and the choices involved in analyzing an interrupted record. Explicitly fictional examples show how those choices work. They are teaching devices, not reconstructions of patient data, predictions of a personal response or schedules to follow. Keeping these distinctions visible makes research more useful for understanding what a skincare claim actually requires.
Study figure and data
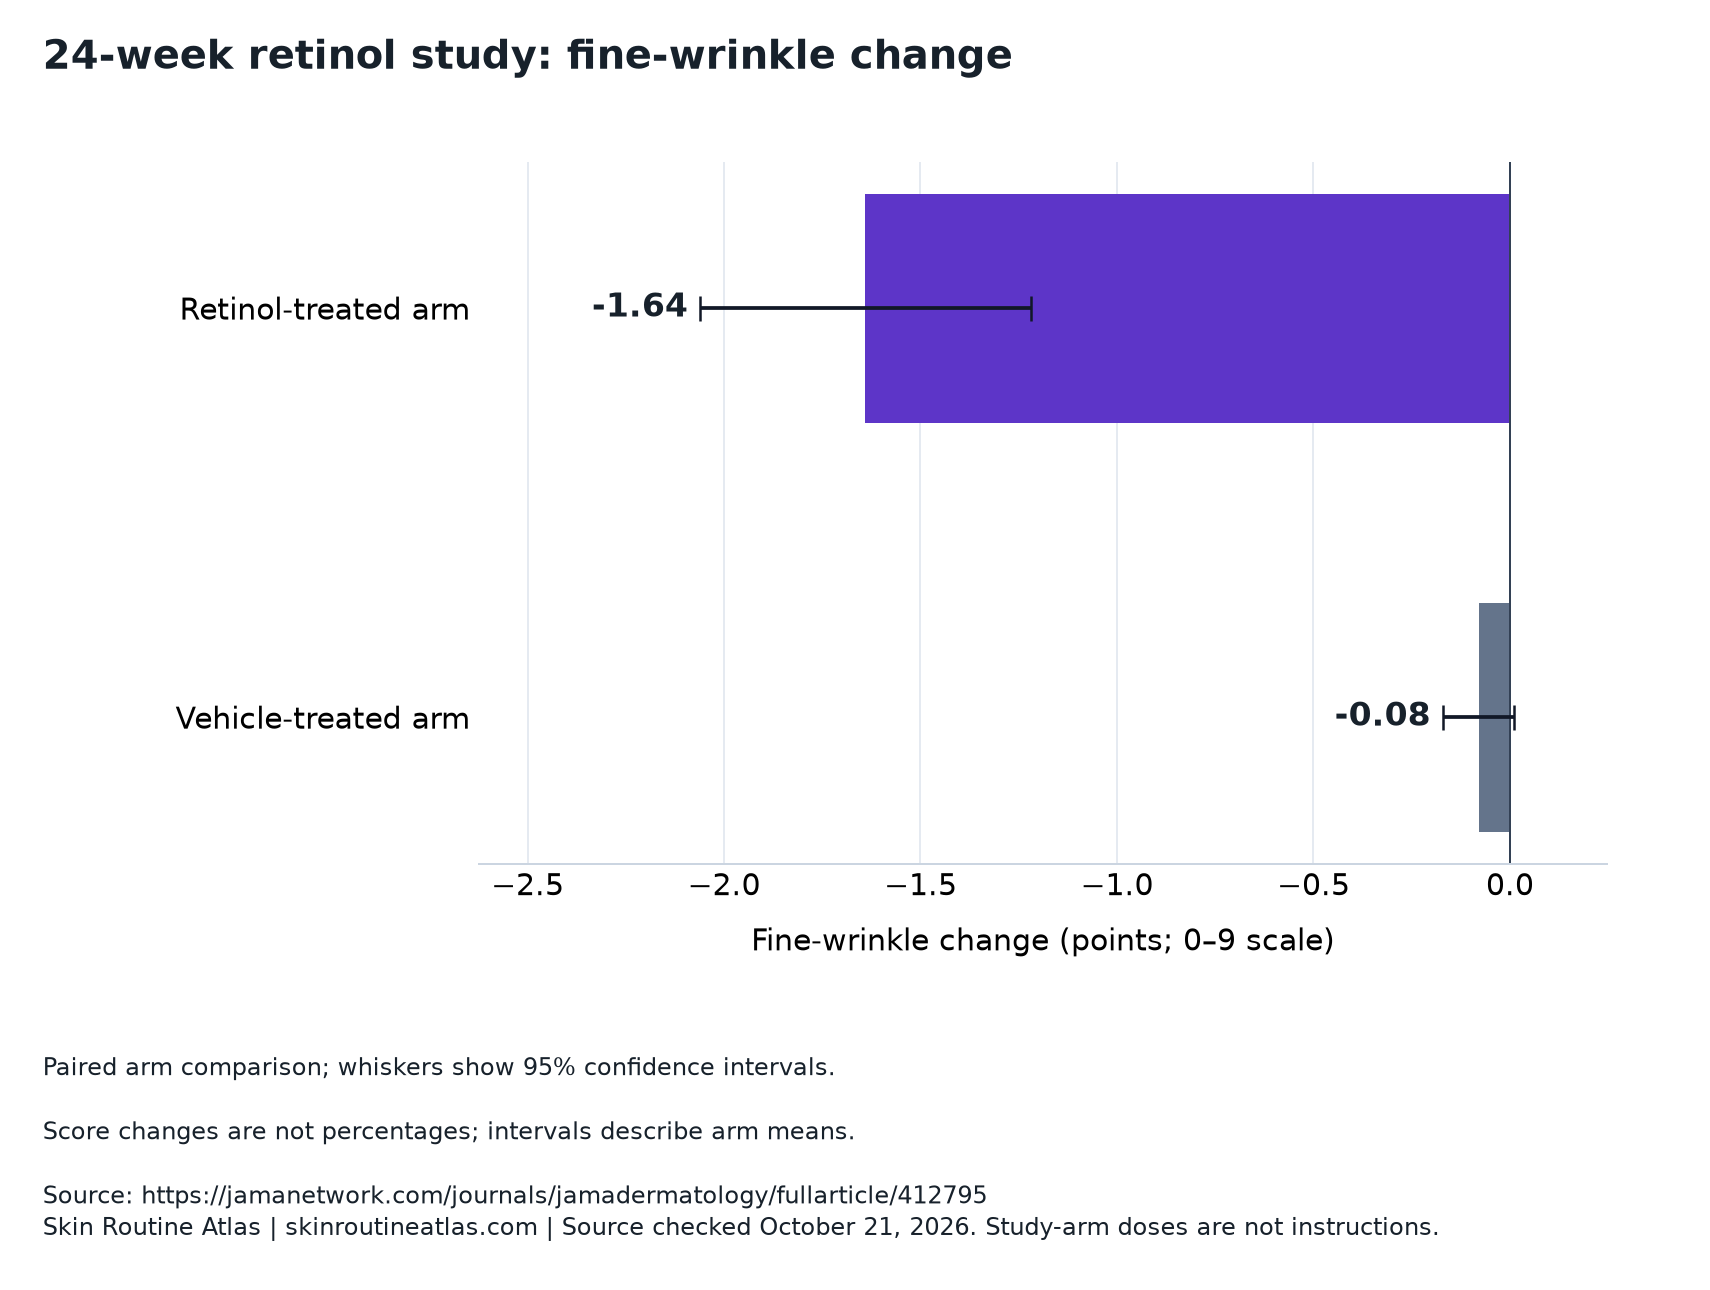
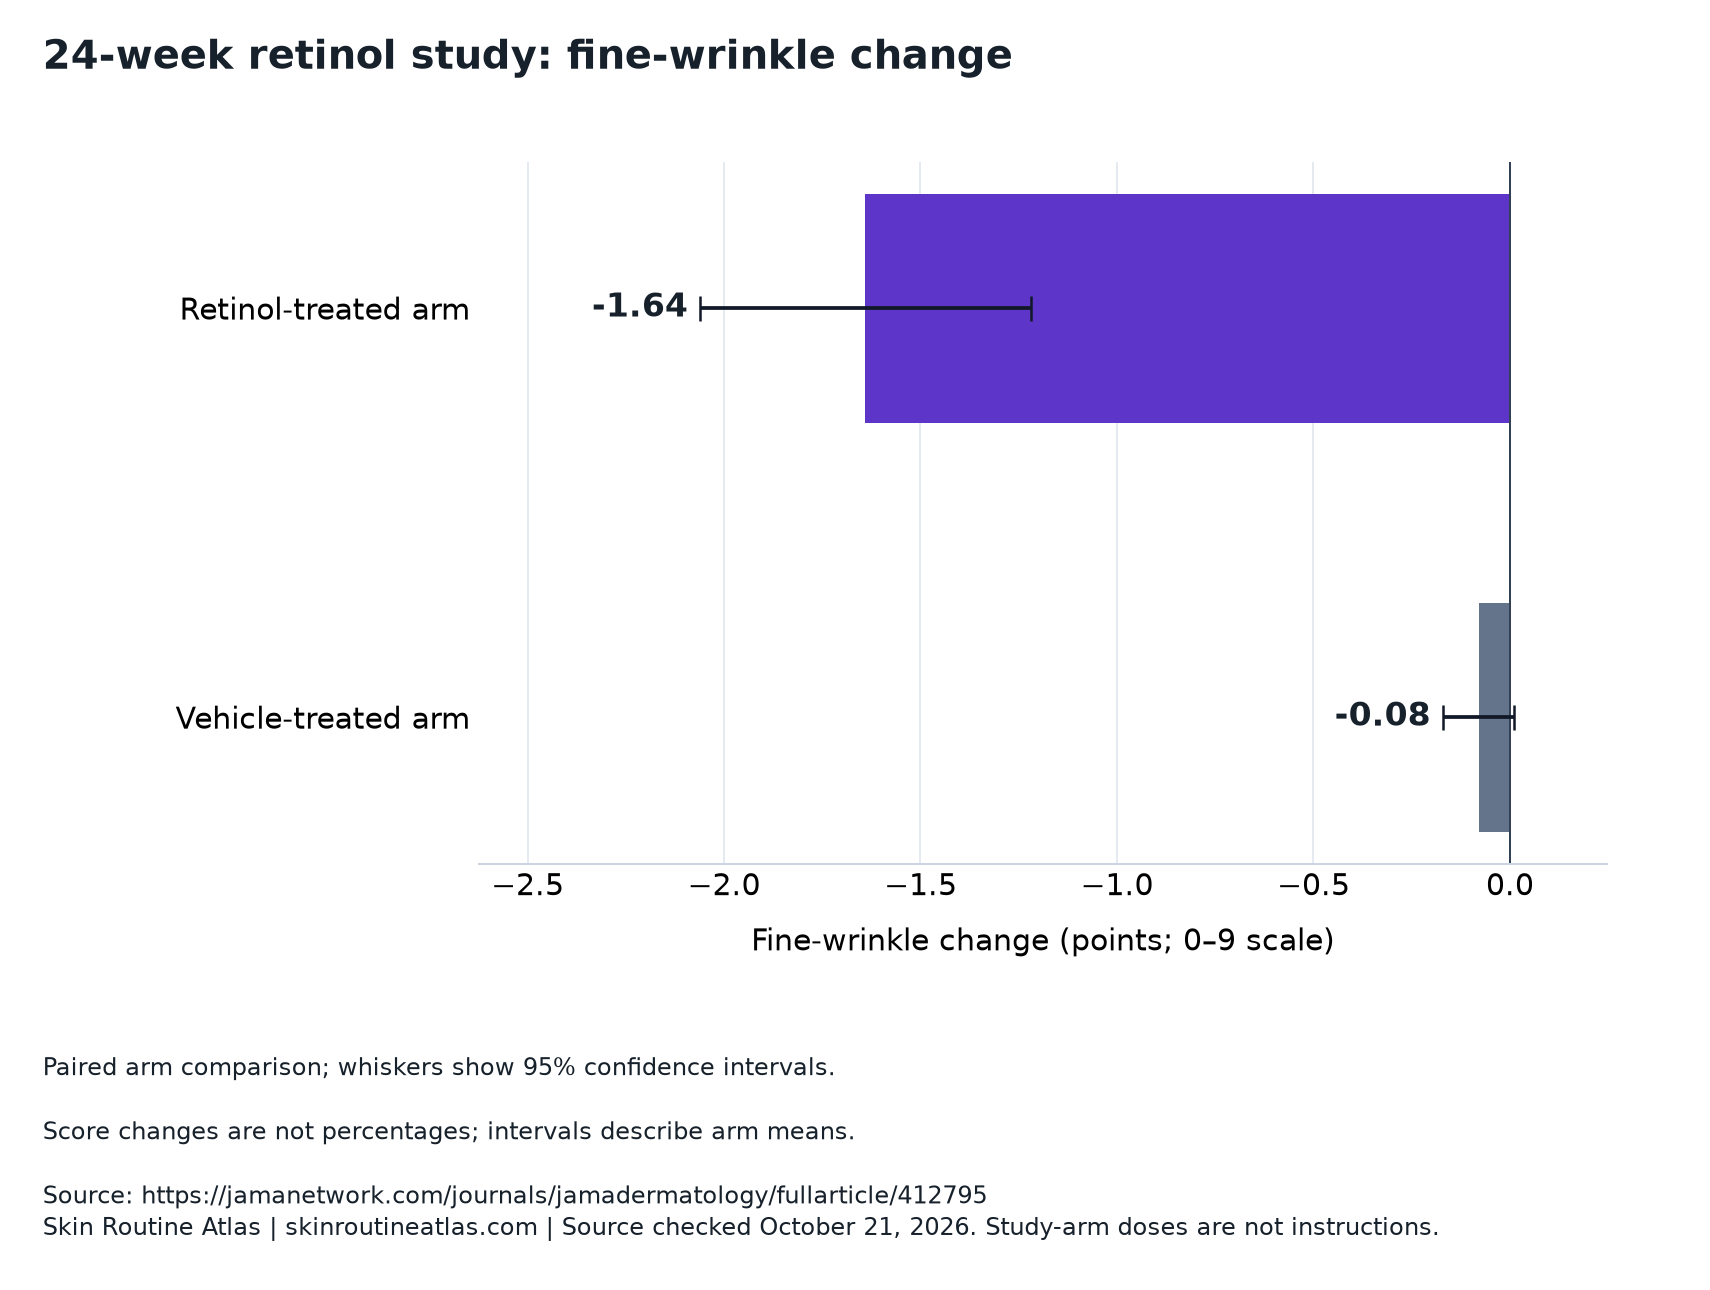
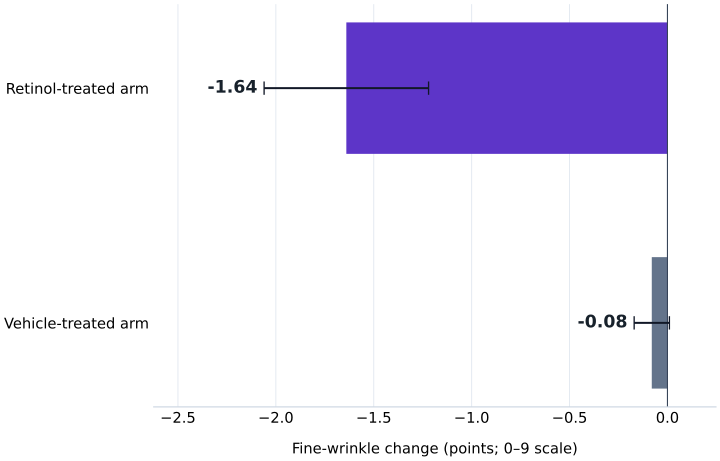
Paired arm comparison; whiskers show 95% confidence intervals.
Score changes are not percentages; intervals describe arm means.
Download source-labeled chart (PNG)Download chart data (CSV)Download vector chart (SVG)
| Study group | Reported value | 95% confidence interval |
|---|---|---|
| Retinol-treated arm | -1.64 | -2.06 to -1.22 |
| Vehicle-treated arm | -0.08 | -0.17 to 0.01 |
Sections in this article
Start with the unit that connects the observations
A paired experiment uses a connection between observations to organize its comparison. When two conditions are assigned within a person, the analysis should preserve that relationship. The two observations share a participant rather than representing two independently recruited people. Counting treatment sites as independent participants would misdescribe the source of information.
The advantage of pairing is easiest to understand through a hypothetical design. Suppose people differ in a stable characteristic that affects the measurement on both sites. Comparing the two sites within each person can remove some of that shared variation from the contrast. It does not remove every possible difference between sites. Assignment, measurement and the suitability of the comparison still require scrutiny.
A useful reading habit is to identify the participant identifier, site identifier and observation time before interpreting a graph. These describe which records belong together. Our guide to retinol and tretinoin labels addresses product identity; the parallel research question is observation identity. Which measurements share a person, which share a time point, and which condition belongs to each? A clear answer prevents a dataset from being treated as a collection of interchangeable numbers.
A difference should be calculated before the connection is lost
A deliberately fictional example can show the paired calculation without borrowing any clinical result. Imagine three people observed under conditions A and B. Positive values in the table represent decreases on an invented score. Subtract the decrease under B from the decrease under A for each person. That preserves the individual pairing before the results are summarized.
The paired advantages are two, minus one and two points, averaging one point. One person favors the other condition even though the average favors A. Thus a positive average does not mean every person benefited more. The table also cannot tell us whether a one-point difference would matter to someone; that requires an interpretation of the invented scale that arithmetic alone cannot provide.
If the rows were rearranged independently within each condition, the two group averages would remain the same, but the original pairing would disappear. That loss matters for estimating uncertainty, which depends on how the observations vary together. Published group averages therefore do not provide enough information to recreate every paired analysis. A sound explanation distinguishes what can be calculated from those averages from what requires the connected observations or additional reported statistics.
| Fictional participant | Decrease under A / B | Paired advantage of A |
|---|---|---|
| Person P | 3 / 1 points | 2 points |
| Person Q | 0 / 1 points | −1 point |
| Person R | 4 / 2 points | 2 points |
Consistent measurements make change interpretable
An outcome is defined partly by how it is measured. A rating, a photograph and a laboratory assay need not represent the same feature, even when all are described as evidence of improvement. Before interpreting change, identify the scale, its direction and the procedure used to produce each observation. Repeating a label is not enough if its practical meaning has shifted.
Consider an imagined photographic assessment in which lighting changes between visits. A difference in appearance could then reflect more than a change in skin. This example does not allege a flaw in the published experiment; it illustrates why a measurement protocol matters. Likewise, a different assessor might apply rating categories differently. Standardization and masking are design tools intended to address particular sources of variation or expectation, not guarantees that every uncertainty has vanished.
The guide to preparing for a skincare visit offers context for organizing observations. Scientifically, an orderly record helps separate when a change was noticed from how it was assessed. It does not by itself identify a cause. That distinction allows a personal account to remain useful without giving it the evidential role of a controlled comparison or treating every visible difference as the same outcome.
An exposure record is different from an intended schedule
The schedule attached to an experiment describes planned opportunities for treatment. The exposure record describes what actually happened. Those are separate variables. An interpretation that silently replaces one with the other can attribute an outcome to a treatment experience that the observations do not represent.
Imagine two hypothetical participants offered the same sequence of visits. One has an interruption and the other does not. Comparing their final outcomes according to completed visits would not reproduce the original assigned comparison: it would also compare people whose experiences led to different exposure. The reason for an interruption could be relevant to the outcome being studied. A simple association between more applications and a better score would therefore need more analysis before supporting a causal claim.
Our routine-inventory guide provides a place to organize product information. In a research record, the corresponding task is to distinguish assignment, actual exposure and subsequent observation. A pause can be documented without being converted into a recommended schedule. What matters for appraisal is whether the analysis states which treatment experience it estimates and how interruptions entered that estimate. Historical study administration supplies context for interpretation, not personal instructions.
Missing outcomes create an assumption, not a new observation
A missing final measurement remains unknown even when a statistical procedure assigns it a value. Last observation carried forward, abbreviated LOCF, uses an earlier available measurement for a later unavailable one. Intent-to-treat, abbreviated ITT, concerns retaining people according to their assigned conditions; the label alone does not specify a missing-data method or eliminate the consequences of unavailable outcomes.
For a purely hypothetical example, suppose a participant has a score of twelve at an intermediate visit and no final rating. Carrying twelve forward does not demonstrate that the score remained twelve. It makes that value part of the calculation. An analysis restricted to completed follow-up makes another choice: it uses the people with the required observations. That can change the population represented by the result.
A useful sensitivity analysis would ask how conclusions change under other plausible assumptions about the missing values. It should identify those assumptions explicitly rather than present them as recovered measurements. The same principle applies to a personal record: absence of an entry should not automatically be coded as no change, no symptoms or no exposure. Each substitution answers a different question and deserves to remain distinguishable from something actually observed.
Follow-up and treatment participation need separate timelines
Stopping an intervention and stopping observation are different events. A study could continue measuring outcomes after treatment ends, or it could lose later measurements as well. The distinction matters because an effect of assignment over a defined period differs from an outcome observed only while treatment continues. Neither description should be inferred solely from the presence of a final summary number.
An imagined participant-flow record could mark entry, assignment, exposure changes, scheduled assessments and the last available outcome separately. Reasons for missing visits could be recorded alongside these events without being used to guess the unseen result. This structure helps an analyst ask whether the people represented near the end differ from those who entered, and whether the interpretation matches the chosen follow-up period.
The companion analysis of concentration research examines related questions about measurement and observation. Longer observation is not automatically more complete observation, and a calendar duration does not tell us how much information each person contributed. A useful report therefore connects every displayed result to an analyzed population and time point. That makes later comparisons possible without implying that all enrolled people supplied all measurements or that a summary describes every individual course.
The uncertainty belongs to a particular estimate
A confidence interval concerns uncertainty about an estimated quantity under the method and assumptions used. It is not a range of expected personal outcomes. Standard error, or SE, describes the estimated variability of an estimator. These ideas are related, but a standard-error bar and a confidence interval are not interchangeable labels for the same display.
In a paired analysis, the precision of a difference depends partly on how the observations are related within people. Subtracting endpoints from two separate group intervals does not reconstruct a valid interval for that paired difference. Nor does the visual overlap of bars supply every test needed to interpret the comparison. The relevant statistic must correspond to the question and design.
An explicitly fictional average advantage of one point illustrates another boundary. Even a precisely estimated advantage would still need a clinical interpretation: what does that point represent, and what difference would matter? Conversely, an imprecise estimate need not mean the true effect is zero. A responsible account keeps magnitude, uncertainty and practical importance separate. It also distinguishes a reported estimate from newly calculated arithmetic, so readers know which numbers came from the research and which were introduced to explain it.
Selection of measurements changes the visible evidence
Only significant biopsy findings reported: glycosaminoglycans (n=6), procollagen I (n=4). Injury/ulcer protection remained hypothetical.
When several measurements are explored, the set presented to readers matters as well as each result within it. Seeing a selected signal is different from seeing a complete account of the planned and exploratory analyses. An appraisal should ask how measurements were chosen, which were analyzed and how presentation decisions were made. These questions concern the evidence record, not an assumption that any particular result must be false.
For a hypothetical future investigation, researchers might specify candidate biological measurements in advance, report each planned analysis and distinguish exploratory findings from the primary test. They could separately measure a clinical outcome that a proposed mechanism is intended to explain. Even then, parallel changes would not automatically establish that one caused the other. A causal explanation needs evidence connecting the steps and addressing alternative routes. The useful distinction is between a finding that motivates a hypothesis and a design that tests the hypothesis itself. That keeps a promising biological account available for investigation without turning it into a result the observations did not establish.
Related reports need their own observation records
The 1995 abstract reports 99 completers, 48 weeks and tretinoin 0.1%/0.025% versus vehicle, with greater erythema and scaling at higher strength. The randomized 2005 report studied 204 participants, 0.05% tretinoin emollient cream versus vehicle, for up to two years; its abstract describes facial-photodamage improvement without numerical effect estimates or confidence intervals.
RENOVA 0.02% labeling addresses adjunctive mitigation of fine facial wrinkles with comprehensive skincare and sunlight avoidance, not wrinkle elimination or sun-damage repair. Safety and effectiveness beyond 52 weeks or above age 71 are unestablished; pregnancy or attempted pregnancy precludes use under the label.
A synthesis should preserve the boundaries between these documents. It cannot combine their populations into an imagined shared experiment or use a longer observation period to fill a missing outcome in another report. Differences in preparation, setting and measurement belong to the interpretation, even when ingredient names appear related. The table supplies a map for keeping document types separate. Connecting research to an exact preparation requires an argument about relevance, and any asserted comparative performance needs an appropriate comparison. A concentration printed on a package does not supply that comparison by itself.
| Document | Access used here | Question to preserve |
|---|---|---|
| 1995 study | Primary abstract | Which conditions were compared? |
| 2005 study | Primary abstract | Which outcomes and follow-up were described? |
| RENOVA label | Current official text | Which exact product does the statement cover? |
Trace a claim to its evidence rather than its presentation
Four inventors disclosed conditional royalties; funding or payments cannot be inferred.
An interest declaration belongs in the evidence record alongside methods and results. It does not replace examination of those methods, nor should its wording be expanded into an unsupported financial history. The appraisal question is how transparently the work can be assessed and what further evidence would strengthen or challenge its interpretation. That is different from treating either a disclosure or its absence as a verdict on the result.
The Dermstore review and Amazon skincare review can help inspect documentary terms for particular offers. They do not establish that a listed preparation matches an experimental formulation or reproduces a study outcome. Our editorial interpretation is that product records and research records should be linked through explicit claims that can be checked. A catalogue entry may identify an offer; a controlled comparison addresses a defined scientific question. Preserve both identities when deciding what evidence a statement requires. This allows a routine record, a commercial review and a research article to serve useful, distinct purposes without giving any one of them an authority its observations do not provide.
Questions about the evidence
Why should paired observations stay connected?
The connection identifies which measurements belong to the same participant. Preserving it allows the analysis to account for how observations vary together. Treating the sites as independently recruited people would misdescribe the design. A pair also does not mean two identical sites; assignment and measurement procedures still need to support the intended comparison.
Does a recorded interruption identify the best schedule?
No. An interruption documents an event, while a preferred schedule is a comparative treatment claim. People with different exposure may also differ in why that exposure changed. A causal conclusion would need an appropriate design and analysis. A historical exposure record should therefore be interpreted as part of the experiment, not converted into personal instructions.
What is the difference between an imputed value and an observed value?
An observed value comes from a measurement. An imputed value is supplied by an analytical rule when information is unavailable. The rule can make a calculation possible, but it does not recover the unseen outcome with certainty. Reports should identify the rule and assess how conclusions depend on its assumptions.
Can careful personal notes establish that one product caused a change?
They can document timing and experience, but an orderly timeline does not itself supply a suitable comparator or remove competing explanations. Several features may change together, and measurements may vary. Such notes can support a discussion and help formulate a question without having the same evidential role as an experiment designed to test that question.
Why keep biological measurements separate from clinical outcomes?
They can contribute different information. A biological measurement may suggest an explanation or motivate a future test; a clinical outcome addresses the specified clinical question. Establishing the proposed connection requires additional evidence about the pathway. Treating them as interchangeable can turn an interesting hypothesis into an unsupported claim about an outcome that was never measured.
Editorial assessment
The most useful reading of a skin experiment follows the observations through assignment, exposure, measurement and analysis. Pairing should remain intact, interruptions should remain visible and unavailable outcomes should stay distinguishable from observed ones. This approach does not require rejecting a result whenever the record is incomplete. It requires stating which comparison the available record supports and which assumptions carry the interpretation beyond it. A carefully framed question then guides the next step: improve the measurement, test a different assumption, examine another preparation or collect the clinical outcome needed to assess a proposed explanation.
Research access and limitations
Retinol: full publisher article, table footnote, Comment, disclosure. Tretinoin: indexed abstracts only. RENOVA: current official label. Worked examples and proposed analyses are hypothetical, not observed patient data. This article offers research interpretation, not an individual regimen.
Sources and access notes
Sources checked October 21, 2026. Access notes identify the material examined for this article.
- Improvement of naturally aged skin with vitamin A (retinol).
Full publisher research article, including original clinical table-image footnote, figure captions, Comment and Financial Disclosure; no supplements or individual data reviewed. · Checked October 21, 2026
- Two concentrations of topical tretinoin (retinoic acid) cause similar improvement of photoaging but different degrees of irritation. A double-blind, vehicle-controlled comparison of 0.1% and 0.025% tretinoin creams.
Indexed original research abstract · Checked October 21, 2026
- Long-term efficacy and safety of tretinoin emollient cream 0.05% in the treatment of photodamaged facial skin: a two-year, randomized, placebo-controlled trial.
Indexed original research abstract · Checked October 21, 2026
- DailyMed - RENOVA- tretinoin cream
Official current labeling retrieved in full · Checked October 21, 2026