A study result is the last step in a sequence of observations. Someone identified the treatment, defined a measurement, recorded a starting value, and attempted to collect another value later. Choices made along that sequence determine what the final number means. When a summary loses those details, a tissue measurement can start to sound like a visible improvement, or an observation among returning participants can sound like a result for everyone who began.
This article follows that measurement record through topical skincare research. The emphasis is on interpreting evidence, rather than turning research visits into a personal treatment calendar. A record kept at home can help describe an experience, while a controlled study addresses a different question about treatment effects. The routine inventory guide offers a starting point for documenting products; the discussion here explains why documentation and proof of benefit are distinct achievements.
Study figure and data
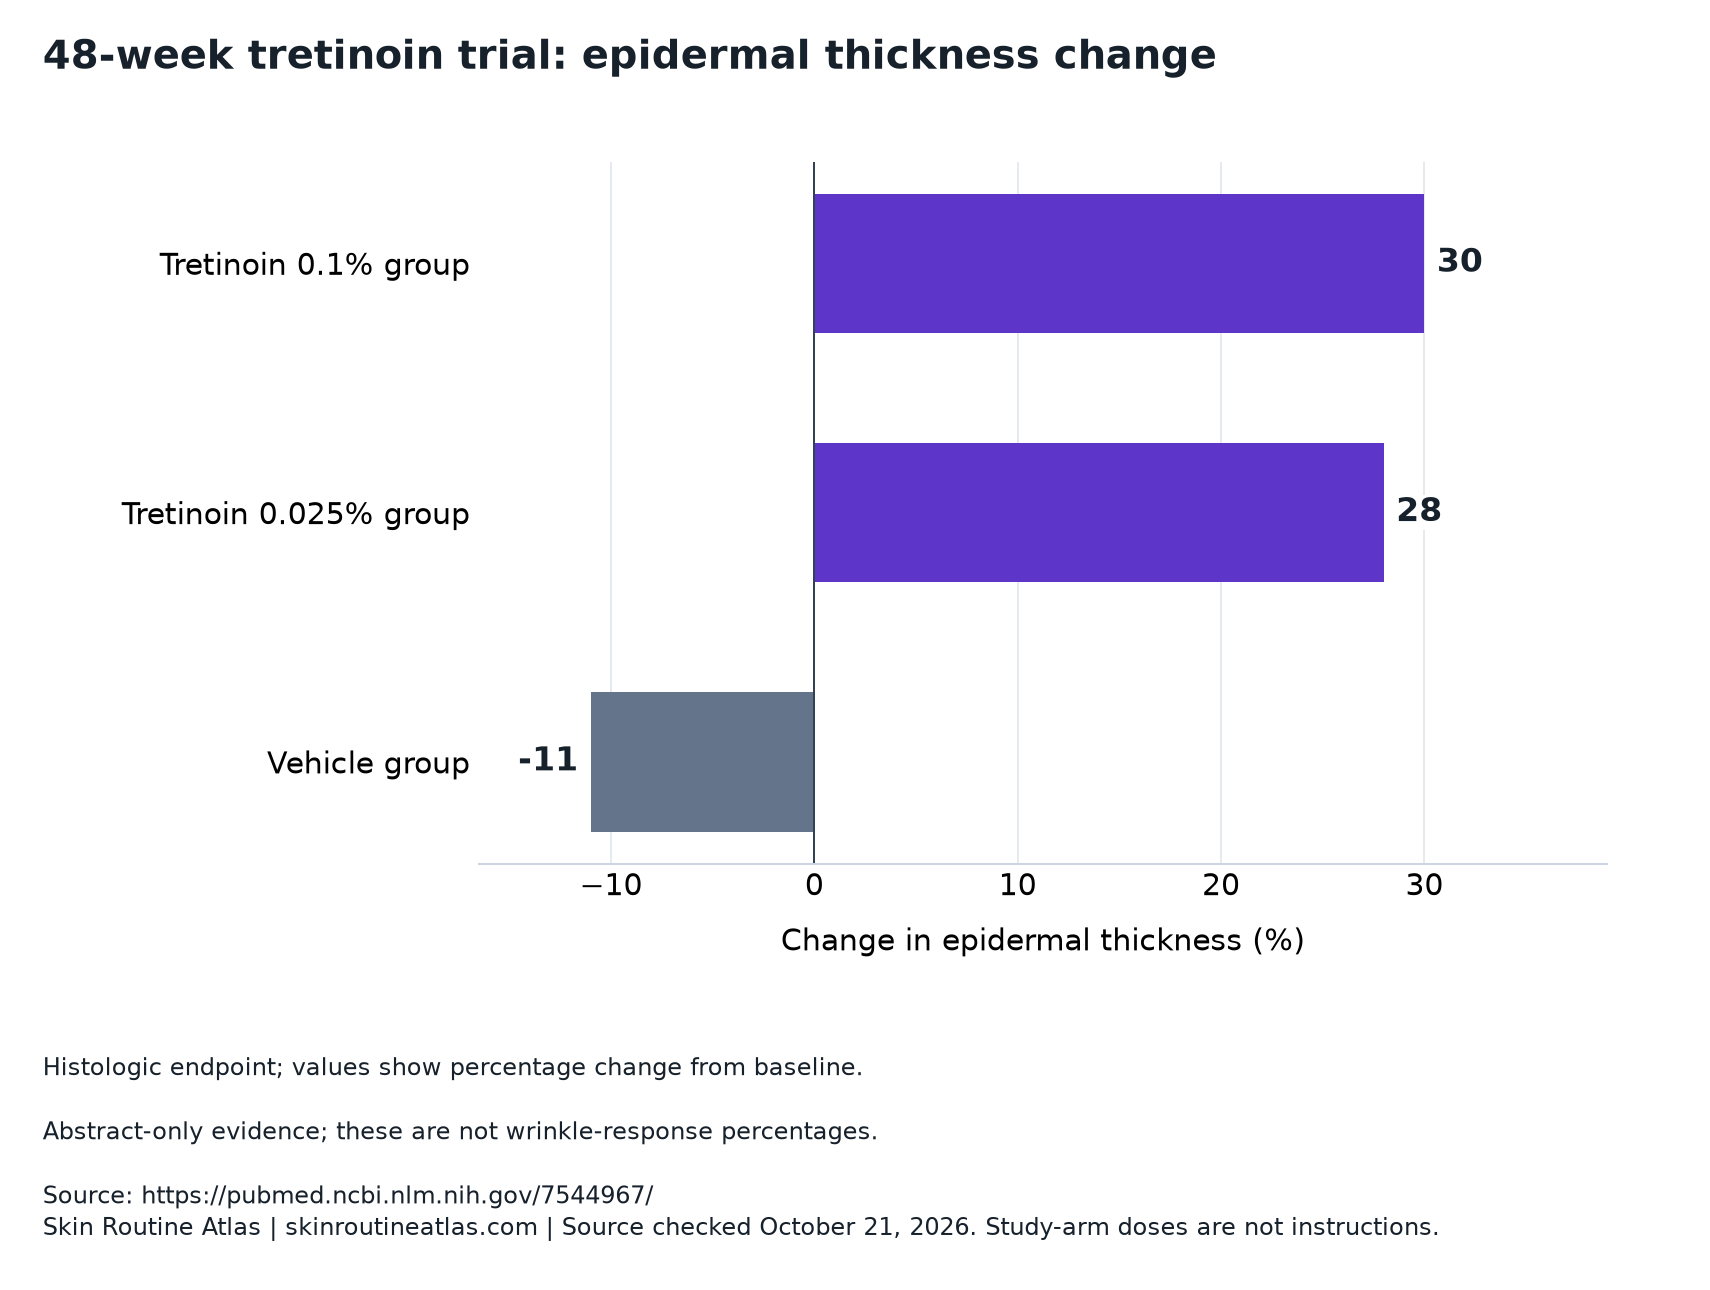
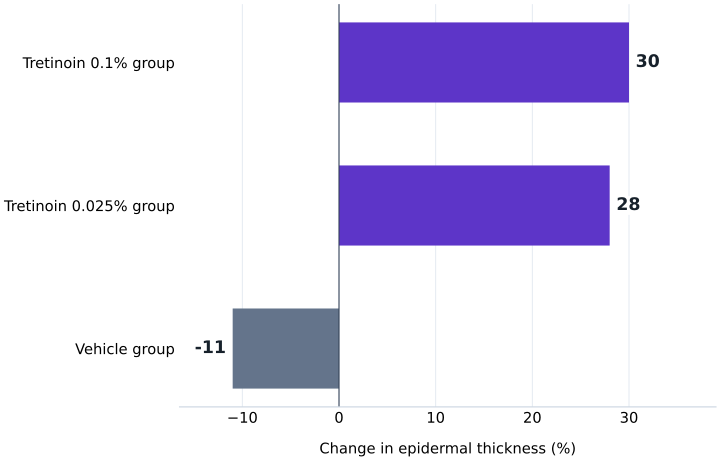
Histologic endpoint; values show percentage change from baseline.
Abstract-only evidence; these are not wrinkle-response percentages.
Download source-labeled chart (PNG)Download chart data (CSV)Download vector chart (SVG)
| Study group | Reported value |
|---|---|
| Tretinoin 0.1% group | 30 |
| Tretinoin 0.025% group | 28 |
| Vehicle group | -11 |
Sections in this article
Identify the observation before reading its size
The first question about a result is what kind of observation produced it. A microscope reading, an assessor’s category and a participant’s description each capture something different. They may be collected at the same appointment, but sharing a date does not give them the same meaning. A useful record names the instrument or assessment, the body site, the units, and the direction considered favorable.
Those details also determine which arithmetic makes sense. A measured area may support a ratio interpretation if its zero and units have that meaning. A numbered category does not necessarily do so: moving between adjacent categories need not represent equal physical changes. Converting every result into a percentage can therefore create an appearance of comparability without a defensible common scale.
An investigator should be able to trace a published summary back to a defined observation, while preserving privacy. For a reader, that trace begins with the methods description rather than the size of a headline number. The retinol and tretinoin label guide addresses a parallel identification problem: the intervention must be named accurately before a result can be connected to it.
Establish who contributed to the reported result
The 1995 abstract describes 99 photoaging-study completers: 32 used topical 0.1% tretinoin cream, 35 used 0.025%, and 32 used vehicle over 48 weeks, with double blinding. Both active arms improved clinically versus vehicle, with similar observed efficacy between concentrations; higher concentration caused more erythema and scaling. Initial enrollment, allocation method, attrition and clinical confidence intervals are unreported. The figure shows tissue measurements, not wrinkle-response percentages.
The number attached to a result should identify the people represented by that result. Participants assessed at a final visit may not be the same set assessed earlier. To investigate that possibility, a reader needs participant flow, reasons for missing observations and the analysis rules. Without that record, it is inappropriate to assign a favorable or unfavorable direction to the missing information.
Design labels answer specific questions, too. Blinding concerns awareness of treatment identity; random assignment concerns how treatment groups were formed. Likewise, apparent similarity does not establish equivalence within a clinically justified margin. A precise reading preserves the distinction between a design feature, an observed result and a stronger inference that would require additional information.
Distinguish a percentage of summaries from a summary of percentages
Two calculations can both be mathematically correct while answering different questions. Consider an invented laboratory measurement in two hypothetical participants. The first changes from 10 to 20 units, a 100% increase. The second remains at 90 units, a 0% increase. Averaging their individual percentage changes gives 50%. These values illustrate arithmetic only; they are not findings from a skin study.
The average starting measurement is 50 units, while the average final measurement is 55. The percentage change in those averages is 10%, because the five-unit increase is divided by 50. That differs from the average individual percentage change because the calculations weight the starting measurements differently. Neither calculation can silently substitute for the other.
This distinction explains why a report should identify its summary method. A figure described only as a group-level percentage does not authorize the reader to call it an average of individual responses. Nor can either percentage be translated into the proportion of people helped. To answer that question, the investigator would need a participant-level definition of improvement and a count using that definition. A denominator is part of the scientific meaning, not a detail to discard after calculation.
Compare changes while keeping starting values visible
An intervention group can improve even when its comparator also improves. The treatment contrast depends on how the two histories are compared. A final-score difference and a difference in changes are not always numerically identical, especially when starting scores differ. The analysis should explain which quantity addresses the planned question and how baseline information is handled.
For a fictional example, assume lower scores indicate less severity. An active group starts at eight and finishes at five; a comparison group starts at seven and finishes at six. Their changes are −3 and −1, producing a change difference of −2 points. Their final scores differ by −1 point. The table preserves all three distinctions rather than describing each as the treatment effect.
These simple subtractions do not establish which statistical analysis a real trial should use. That choice also depends on design, measurement properties and assumptions. It should not be selected afterward merely because one calculation looks more favorable. Retaining baseline, follow-up and comparator information makes it possible to evaluate the analysis instead of relying on a number detached from its construction.
| Quantity | Active group | Comparison group |
|---|---|---|
| Starting score | 8 | 7 |
| Final score | 5 | 6 |
| Change from starting score | −3 | −1 |
Preserve the variation hidden inside a group summary
A group result compresses many observations. Compression is useful, but it discards information. An average change does not reveal whether most people changed modestly, a small group changed substantially, or improvements and worsening partly canceled each other. A report can recover some of that information by presenting a distribution or a justified response threshold alongside the average.
Imagine ten fictional participants: eight improve by one point and two worsen by one point. The average improvement is 0.6 points, while eight of ten improve at all. Those statements are compatible because they answer different questions. Neither establishes the chance that a particular future patient will improve, and neither says whether a one-point change matters to that person.
Individual records are also needed to connect different kinds of measurements. If one group summary shows a tissue change and another shows visible improvement, the summaries alone do not show that the people with the largest tissue changes had the largest appearance changes. Even a participant-level association would need careful interpretation before being treated as a causal pathway. Keeping measurements linked to the same participant is a prerequisite for investigating that connection, not proof of it.
Separate the planned intervention from the recorded exposure
The full 2007 retinol paper involved 36 adults averaging 87 in a randomized paired-arm comparison of 0.4% lotion and vehicle for 24 weeks; 23 completed. Staff withheld applications for irritation, yielding an actual weekly mean of 1.6. Fine-wrinkle improvement favored retinol. Three withdrew for irritation or pruritus. The schedule describes that experiment, not instructions for personal use.
A plan documents what investigators intended to deliver; an exposure record documents what happened. Differences between them can be relevant to both interpretation and safety. A useful analysis states whether it addresses assignment to treatment, a particular pattern of actual use, or another explicitly defined question. These questions can involve different assumptions about why use changed.
Actual exposure is not automatically a better basis for causal comparison. In a hypothetical study, participants who tolerate an intervention could use it more consistently than those who experience difficulty. Comparing these groups directly might then mix the effect of exposure with differences that influenced continued use. The retinol research guide examines the paired experiment more closely. Here, the central lesson is to retain both the intended plan and the observed history without pretending they answer the same question.
Read repeated observations as a trajectory
Two histories can end at the same value after taking different paths. The fictional series below illustrates a gradual change in one pattern and an early change followed by partial reversal in another. Both begin and finish together. Looking only at the first and final observations would hide that difference, while looking only at the most favorable intermediate observation would create another incomplete account.
Observation timing determines which parts of a trajectory can be seen. A missed assessment is a gap, not evidence that nothing happened between neighboring visits. Filling that gap with a straight line creates an assumption about the path. Such an assumption can be useful for a stated analysis, but it should remain distinguishable from an actual measurement.
A prospective research plan should align observation times with its scientific question and report departures from that plan. There is no universal visit pattern supplied by this example. For a personal clinical conversation, the visit preparation guide is a place to organize dated observations and questions. The purpose is to describe what was noticed and when, rather than use a fictional research sequence to decide treatment timing.
| Observation | Gradual pattern | Early-change pattern |
|---|---|---|
| Starting observation | 6 | 6 |
| Intermediate observation A | 5 | 2 |
| Intermediate observation B | 4 | 3 |
| Final observation | 3 | 3 |
Match follow-up to the conclusion it can support
The 2005 randomized study included 204 participants receiving 0.05% tretinoin emollient cream or vehicle for up to two years. Its abstract reports improved clinical photodamage measures and a month-12 procollagen marker, without numerical clinical effect sizes or confidence intervals. No increase in specified microscopic abnormalities was reported versus vehicle; that does not establish cancer prevention.
Longer observation and more complete observation are separate properties. A study may cover a long calendar period while collecting limited information about some participants. Evaluating a lasting-effect claim therefore requires more than the final date: it requires the people observed, their exposure history and the outcome definition throughout follow-up. The time window alone cannot supply missing detail.
An additional distinction concerns what happens during treatment versus after it ends. Persistence after exposure is a separate research question requiring its own observations. A tissue marker introduces yet another question if it is proposed as evidence of a later clinical event. That connection needs investigation rather than inference from timing alone. A credible interpretation should specify which link is directly observed and which link remains a hypothesis, even when the sequence sounds biologically plausible.
Use a personal record to describe experience rather than prove an effect
RENOVA 0.02% labeling addresses fine facial wrinkles alongside skin care and sunlight avoidance, not reversal of photoaging. Safety and effectiveness beyond 52 weeks or above age 71 are unestablished. The label warns against use during pregnancy or attempted pregnancy and describes local irritation and increased sunburn susceptibility. Its statements concern the exact labeled formulation.
A personal routine record can preserve product identity, dates, observed symptoms and questions for a clinician. It cannot create the unobserved comparison of what would have happened to the same person at the same time without the product. Changes in several products or circumstances can further complicate interpretation. More detailed notes improve the description; they do not by themselves remove competing explanations.
Our editorial interpretation is to keep documents and observations together without overstating either. The Smooth Move review provides a place to inspect documented product terms, while the Amazon skincare review addresses documentation of a particular offer. Neither link transfers study outcomes to a provider or retailer. Personal notes can support discussion of an exact product and a particular experience, but they should not become a self-directed experiment or a basis for changing a prescription.
Keep uncertainty and provenance attached to the result
A measurement record is incomplete if it contains only the favorable estimate. Its interpretation also depends on uncertainty, the planned analysis and the possibility of selective reporting. Multiple measurements can produce different signals; an honest account distinguishes a primary question from exploratory findings and reports how those roles were determined. A striking result discovered after searching many outcomes needs a different interpretation from a prespecified primary test.
Provenance includes financial relationships and access boundaries. Four retinol investigators disclosed possible invention-related royalties conditional on licensing and sales. The tretinoin abstracts do not identify funding. Those facts should be recorded precisely, without treating an undisclosed relationship as established or assuming that a stated interest determines whether the result is correct. Study conduct and reporting still need their own assessment.
Our editorial assessment is that a useful scientific record makes uncertainty locatable: which measurement, participant group, comparison or follow-up assumption could change the conclusion? This is more informative than attaching a broad disclaimer to an otherwise absolute claim. It also gives future research a concrete task. A better measurement, a more complete observation history or a direct test of a proposed connection can answer a defined uncertainty rather than merely produce another impressive number.
Questions about the evidence
Does a before-and-after photograph establish that a product worked?
It records an appearance at two moments, assuming the images are interpretable. It does not supply a controlled alternative explaining what would have happened otherwise. Differences in viewing conditions and other changes also need consideration. A photograph can contribute to a record while remaining insufficient, by itself, to identify a treatment effect.
Why should the units stay visible in a chart?
Units tell the reader what changed and which comparisons are legitimate. Without them, a laboratory measurement can be mistaken for a symptom rating or a proportion of participants. Keeping the original units also makes it easier to notice when a percentage calculation has introduced a different denominator or question.
Can a final visit describe the experience between visits?
It describes the observation made at that point. To reconstruct the intervening course, an investigator needs additional observations or clearly stated assumptions. Several different histories can lead to the same final value, so choosing a smooth or favorable path after seeing the endpoint would add information the measurement itself does not contain.
When does a missing observation become a problem for interpretation?
It matters when the conclusion depends on what is unknown. The effect can vary with the amount missing, the reasons it is missing and the analysis question. The useful response is to explain those factors and examine justified alternatives, rather than assume that every missing value is unchanged, improved or worsened.
What should a routine log contribute to a clinical conversation?
It can make the description more specific: which documented product was involved, what was noticed, and when the observation occurred. It can also separate remembered impressions from contemporaneous notes. Its role is to support discussion and clarify uncertainty, not to diagnose a reaction or establish a personal treatment schedule without clinical guidance.
Editorial assessment
The value of a result depends on the record that gives it meaning. Identifying the measurement, retaining its units, specifying the comparator and following the people behind the summary are connected scientific tasks. A group-level estimate can answer a useful question without describing every individual experience or every point in time. Our editorial conclusion is to preserve those boundaries when moving from research to a routine discussion. Personal documentation can improve the account of an experience; controlled research can investigate treatment effects. Keeping their roles distinct helps each form of evidence contribute what it actually contains.
Research access and limitations
The concentration and long-term tretinoin evidence is read through indexed abstracts. The retinol evidence includes the full publisher paper and its clinical-table footnote and financial disclosure. Current official RENOVA labeling provides product-specific information. Protocols, supplements and participant-level data were not comprehensively reviewed. All numerical teaching examples are invented and are not reconstructed observations or personal treatment instructions.
Sources and access notes
Sources checked October 21, 2026. Access notes identify the material examined for this article.
- Two concentrations of topical tretinoin (retinoic acid) cause similar improvement of photoaging but different degrees of irritation. A double-blind, vehicle-controlled comparison of 0.1% and 0.025% tretinoin creams.
Indexed original research abstract · Checked October 21, 2026
- Improvement of naturally aged skin with vitamin A (retinol).
Full publisher research article, including original clinical table-image footnote, figure captions, Comment and Financial Disclosure; no supplements or individual data reviewed. · Checked October 21, 2026
- Long-term efficacy and safety of tretinoin emollient cream 0.05% in the treatment of photodamaged facial skin: a two-year, randomized, placebo-controlled trial.
Indexed original research abstract · Checked October 21, 2026
- DailyMed - RENOVA- tretinoin cream
Official current labeling retrieved in full · Checked October 21, 2026